Forex trading can feel overwhelming for beginners, especially when you look at the charts filled with candlesticks, lines, and strange tools. One of the most important elements that helps traders make sense of the market are forex indicators. But what exactly are they, and how do they work? In this guide, we’ll break it down step by step.
What Are Forex Indicators?
Forex indicators are tools used in technical analysis that help traders understand price movements in the currency market. They are mathematical calculations based on price, volume, or open interest, displayed visually on trading charts.
Indicators do not predict the future with 100% accuracy. Instead, they highlight patterns, trends, and signals that give traders insight into possible market directions. When used properly, forex indicators can improve decision-making and help identify profitable trading opportunities.
For example, indicators can show whether a market is overbought or oversold, whether the trend is strong or weak, or when a price might reverse or continue.
Types of Forex Indicators
Forex indicators fall into several categories. Each type provides unique insights, and traders often combine them for better accuracy. Let’s explore the major ones.
1. Trend Indicators
These indicators help traders identify the direction of the market – whether it’s going up (bullish), down (bearish), or sideways (consolidating).
- Examples:
- Moving Averages (MA): Smooth out price data to show the overall direction.
- For instance, if the 50-day MA is above the 200-day MA, it often signals an uptrend.
- MACD (Moving Average Convergence Divergence): Shows the relationship between two moving averages and can signal trend reversals.
- Moving Averages (MA): Smooth out price data to show the overall direction.
Example Chart Moving Averages on a Forex Pair
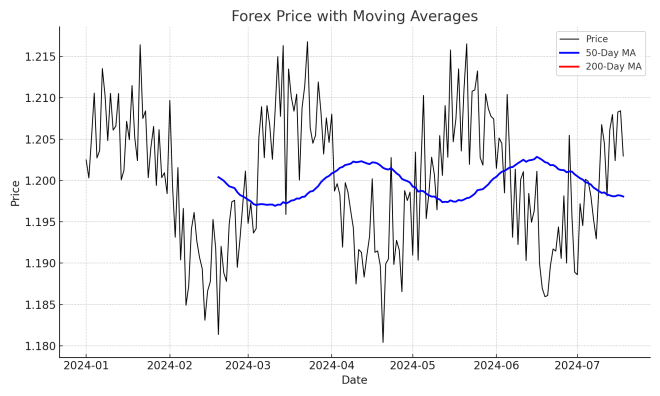
Useful for traders who want to follow the trend rather than trade against it.
2. Momentum Indicators
These indicators measure the speed of price changes and show if a trend is gaining or losing strength.
- Examples:
- Relative Strength Index (RSI): Values above 70 suggest overbought conditions, while values below 30 suggest oversold conditions.
- Stochastic Oscillator: Compares the closing price to the price range over a set period.
Example Chart RSI Indicator
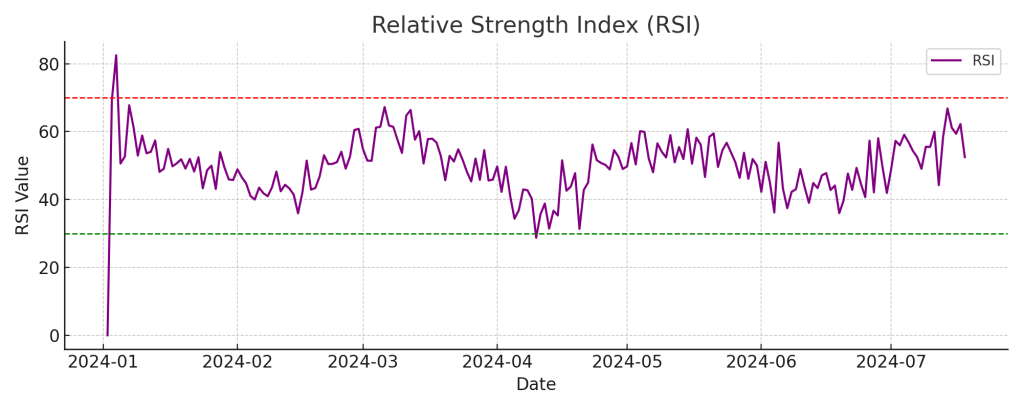
Helpful for spotting potential reversal points in the market.
3. Volatility Indicators
Volatility indicators show how much and how fast prices are moving. They help traders understand whether the market is calm or highly active.
- Examples:
- Bollinger Bands: Consist of a moving average with two bands above and below it. When the bands widen, volatility is high; when they contract, volatility is low.
- Average True Range (ATR): Measures the degree of price volatility.
Example Chart Bollinger Bands

Useful for setting stop-losses and take-profits during volatile periods.
4. Volume Indicators
Volume shows how many traders are participating in the market during a given time. Volume indicators help confirm trends or reversals.
- Examples:
- On-Balance Volume (OBV): Adds volume on up days and subtracts it on down days, helping identify whether volume supports price movement.
- Volume Oscillator: Shows changes in buying and selling pressure.
Example Chart OBV Indicator
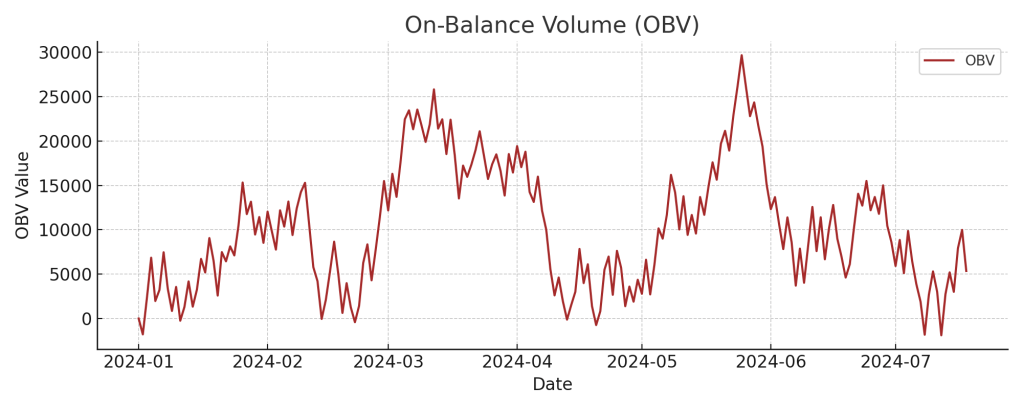
Useful for confirming whether a breakout or trend is strong enough to continue.
How Do Forex Indicators Work Together?
While each indicator provides valuable insights, no single one should be used in isolation. Professional traders often combine different types of indicators to confirm signals.
Example of combining indicators:
- A trader might use Moving Averages (trend indicator) to confirm the market direction.
- Then, check the RSI (momentum indicator) to see if the market is overbought or oversold.
- Finally, use Bollinger Bands (volatility indicator) to set appropriate entry and exit points.
By combining indicators, traders reduce false signals and increase their chances of success.
Forex indicators are powerful tools that can guide traders in making informed decisions. From identifying trends to spotting reversals and measuring volatility, indicators make it easier to understand what’s happening in the forex market. However, success in trading comes from not just knowing the tools, but also learning how to use them correctly in real-life trading conditions.
That’s why we recommend Mikofx Academy as the best place to learn forex for free. With pre-recorded video tutorials, you can study at your own pace and gain the skills you need to trade confidently.
Visit Mikofx Academy today and take your first step toward becoming a successful forex trader!

READ OTHER POSTS
TOP 20 FOREX TERMS EVERY TRADER MUST KNOW


Leave a comment