
forex trading, chart patterns are one of the most powerful tools used to identify potential price movements. They give traders visual clues about market psychology showing when buyers (bulls) or sellers (bears) are in control. Recognizing these patterns can help you predict price breakouts, find entry and exit points, and make informed trading decisions.
In this article, we’ll explore 10 common forex chart patterns, explain what each means, show graphic examples, and describe how to trade them effectively.
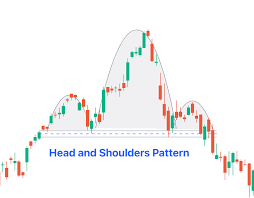
1. Head and Shoulders Pattern
Meaning:
The Head and Shoulders is a reversal pattern that signals a change from an uptrend to a downtrend. It consists of three peaks a higher middle peak (head) between two lower peaks (shoulders).
How to Trade:
- Sell signal: When price breaks below the “neckline” after forming the right shoulder.
- Stop loss: Above the right shoulder.
- Take profit: The same distance as the height from head to neckline.
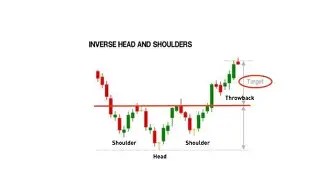
2. Inverse Head and Shoulders
Meaning:
This is the bullish reversal version of the Head and Shoulders pattern, appearing at the end of a downtrend.
How to Trade:
- Buy signal: When price breaks above the neckline.
- Stop loss: Below the right shoulder.
- Take profit: Same height as the distance from head to neckline.
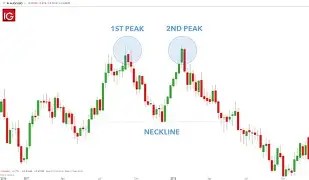
3. Double Top
Meaning:
A Double Top forms after an uptrend and shows a potential reversal. The pattern features two similar highs separated by a moderate low.
How to Trade:
- Sell signal: When price breaks below the middle “neckline.”
- Stop loss: Above the tops.
- Take profit: Equal to the distance between the tops and neckline.
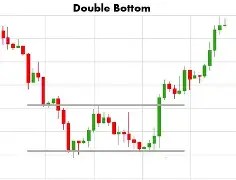
4. Double Bottom
Meaning:
The Double Bottom is a bullish reversal pattern that looks like a “W.” It occurs after a downtrend and indicates that price is likely to rise.
How to Trade:
- Buy signal: When price breaks above the neckline.
- Stop loss: Below the two bottoms.
- Take profit: Distance between neckline and bottoms.
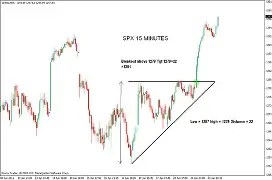
5. Ascending Triangle
Meaning:
An Ascending Triangle is a bullish continuation pattern that forms during an uptrend. It has a flat upper resistance line and a rising lower trendline.
How to Trade:
- Buy signal: When price breaks above the resistance line.
- Stop loss: Below the lower trendline.
- Take profit: Height of the triangle added to the breakout point.
6. Descending Triangle
Meaning:
A Descending Triangle is a bearish continuation pattern seen in downtrends. It has a flat lower support line and a descending upper resistance line.
How to Trade:
- Sell signal: When price breaks below the support line.
- Stop loss: Above the descending trendline.
- Take profit: Height of the triangle subtracted from breakout point.

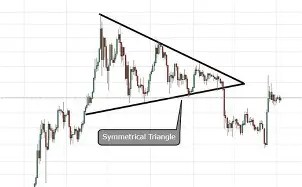
7. Symmetrical Triangle
Meaning:
This pattern indicates consolidation before a breakout. It forms when the highs are getting lower and the lows are getting higher, creating a symmetrical shape.
How to Trade:
- Buy or Sell signal: Wait for breakout in either direction.
- Stop loss: Below last low (for buys) or above last high (for sells).
- Take profit: Equal to the widest part of the triangle.
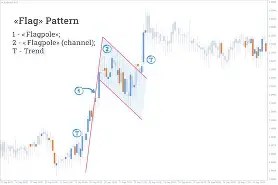
8. Flag Pattern
Meaning:
A Flag is a short-term continuation pattern that looks like a small rectangle slanting against the trend direction.
How to Trade:
- Buy signal: For bullish flags, buy when price breaks above the flag.
- Sell signal: For bearish flags, sell when price breaks below.
- Take profit: Equal to the length of the flagpole.
9. Pennant Pattern
Meaning:
A Pennant is similar to a Flag but forms a small symmetrical triangle after a strong price move. It signals that the trend will likely continue.
How to Trade:
- Buy signal: Break above the pennant for bullish continuation.
- Sell signal: Break below for bearish continuation.
- Take profit: Equal to the size of the previous strong move (flagpole).

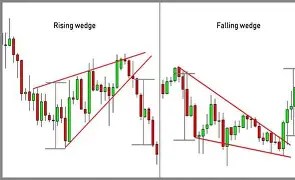
10. Wedge Pattern
Meaning:
A Wedge can be bullish or bearish depending on direction.
- Falling Wedge: Bullish reversal.
- Rising Wedge: Bearish reversal.
How to Trade:
- Buy signal: For falling wedge, when price breaks upward.
- Sell signal: For rising wedge, when price breaks downward.
- Stop loss: Outside the opposite side of the wedge.
How Chart Patterns Help Traders Make Better Decisions
Chart patterns reveal market psychology and momentum shifts before they happen.
- Reversal patterns (like Double Top, Head and Shoulders) help identify when to exit a buy trade or enter a sell trade.
- Continuation patterns (like Flags and Triangles) confirm that a trend will likely continue giving traders the confidence to enter trades in the direction of the trend.
- Breakout zones show areas of high volatility where traders can profit from strong price movements.
By combining chart patterns with risk management tools like stop loss and take profit, traders can make data-driven, emotion-free trading decisions.
- In Summary
For market prices to move effectively in your favour, its important to pay close attention to the various types of charts for accurate market decisions. also for a pratical and comprehensive guide we recommend http://www.mikofxacademy as the best place to get better understanding for easier trainning on forex,

READ OTHER POSTS


Leave a comment