When you first step into the world of forex trading, one of the most common terms you’ll come across is candlesticks. They may look like simple bars or shapes on a chart, but candlesticks are powerful tools that traders use to understand price movement and make better trading decisions.
In this article, we’ll break down what candlesticks are, the different types you should know, and how they can help you as a beginner trader.
What Are Candlesticks?
A candlestick is a type of chart used in forex trading (and other financial markets) that shows the price movement of a currency pair over a specific period of time. Each candlestick gives four key pieces of information:
- Open Price the price at which the currency started trading during that time period.
- Close Price the price at which the currency ended trading during that time period.
- High Price the highest price reached during that time.
- Low Price the lowest price reached during that time.
A candlestick consists of two main parts:
- The Body the thicker part of the candle, which shows the range between the open and close price.
- The Wicks (or Shadows) the thin lines above and below the body, showing the highest and lowest prices during that time.
If the candlestick body is green (or white), it means the price closed higher than it opened (bullish). If it’s red (or black), it means the price closed lower than it opened (bearish).
Types of Candlesticks Every Beginner Should Know
There are many candlestick patterns, but let’s go over some of the most common and beginner-friendly ones.
1. Doji
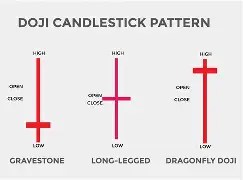
- A Doji forms when the opening and closing prices are almost the same.
- It looks like a cross (+) or a plus sign.
- Meaning: It shows market indecision buyers and sellers are equally strong.
Example: If EUR/USD forms a Doji after a strong upward trend, it may signal that buyers are losing strength and a reversal could happen.
2. Hammer
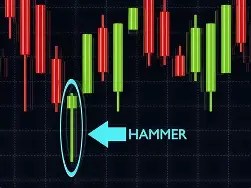
- A Hammer has a small body at the top with a long wick below.
- Meaning: It usually signals a potential bullish reversal after a downtrend.
Example: After GBP/USD has been falling, if a Hammer forms, it could mean buyers are stepping in and prices might rise.
3. Shooting Star
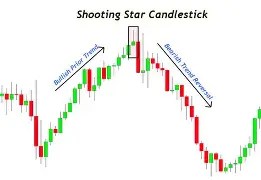
- This looks like the opposite of a Hammer. It has a small body at the bottom and a long wick above.
- Meaning: It suggests a bearish reversal after an uptrend.
Example: If USD/JPY has been climbing and a Shooting Star appears, sellers may be preparing to push the market down.
4. Engulfing Pattern
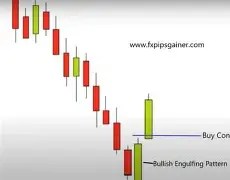
- A Bullish Engulfing occurs when a small red candle is followed by a large green candle that completely “engulfs” it.
- A Bearish Engulfing is the opposite a small green candle followed by a large red one.
- Meaning: Strong reversal signals.
Example: In a downtrend, a Bullish Engulfing candle can mean a powerful shift toward buyers.
5. Spinning Top
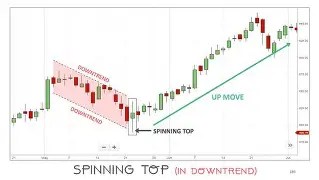
- A candle with a small body and long wicks on both sides.
- Meaning: Market indecision and possible upcoming volatility.
Why Candlesticks Matter for Beginners
Candlesticks are important because they don’t just show numbers they visually represent market psychology. With just one look, you can tell whether buyers (bulls) or sellers (bears) are in control. For beginners, learning candlestick patterns can make analyzing charts much simpler and faster.
Learn Forex the Easy Way
Mastering candlesticks is just the first step in your forex journey. To become consistently profitable, you need structured training and practice. That’s where Miko FX Academy comes in.
Miko FX Academy offers free pre-recorded video tutorials, making it easy to learn forex trading at your own pace, even if you’re just starting out. Whether you’re learning candlestick patterns or advanced strategies, it’s one of the best resources for beginners.
Visit www.mikofxacademy.com today and start your forex learning journey the smart way.

READ OTHER POSTS


Leave a comment